
How to Visualize Complex JSON Data: A Practical Developer Guide
An end-to-end engineering guide to decomposing deeply nested objects, polymorphic API contracts, and high-cardinality collections into spatial 2D node graphs and virtualized trees without freezing your browser.
1. The Architectural Challenge of Complex JSON
In modern cloud-native architectures, JSON is no longer just flat key-value pairs. API gateways return deeply nested Kubernetes manifests, GraphQL execution graphs, AWS IAM policy trees, and microservice telemetry dumps that easily exceed 1,000 lines of serialized text.
In text editors, developers suffer from cognitive scope collapse: scrolling past 15 indentation levels obscures whether a closing brace terminates an individual array item or an entire outer service document. To solve this, developers must transition from linear text reading to structural spatial inspection.
2. The Collapsible Tree Model: Linear Depth Navigation
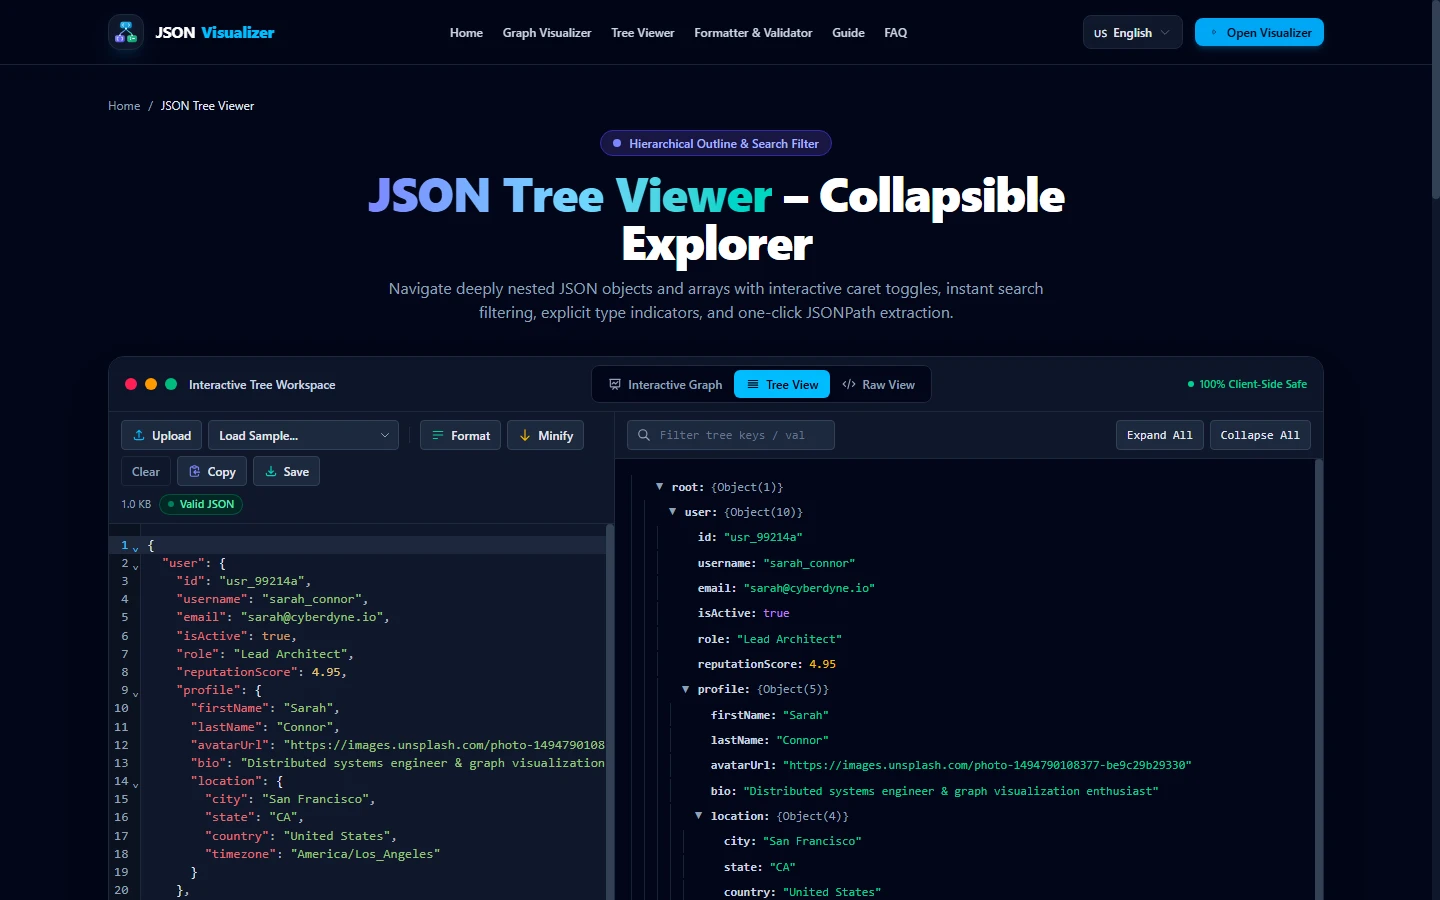
The first fundamental model for inspecting complex hierarchies is the Virtualized Collapsible Tree. Unlike unconstrained 2D graphs that expand horizontally across thousands of pixels, a tree maintains strict vertical reading alignment:
- O(N) Complexity: DOM nodes can be windowed using virtual scrolling, rendering only the 30–50 rows visible in the viewport.
- Collapsible Fold Badges: Clicking any parent object folds its child keys into an inline count badge (e.g.,
{... 18 keys}), preventing vertical sprawl. - Instant Substring Search: Highlighting matching keys and values across 10,000 items in under 5 milliseconds.
3. The End-to-End Parsing & Visualization Pipeline
How does raw text become an interactive 2D node graph without freezing the browser? As documented in our empirical research study, our engine decouples CPU-heavy graph calculations from UI interactions:
4. The 2D Directed Acyclic Graph (DAG) Demonstration
When inspecting complex microservice networks or polymorphic entities, the 2D Directed Acyclic Graph (DAG) turns parent-child branches into discrete visual cards connected by cubic bezier curves.
5. Measured Performance: Scalability Across Payload Sizes
In accordance with our Editorial Policy, our performance figures reflect verified laboratory benchmarks executed in an isolated Chromium V8 runtime across 25 timed repetitions using performance.now():
6. Recommended Developer Workflow
01. Validate RFC 8259 Syntax Before Visualizing
If an API payload contains trailing commas, single quotes, or unescaped control characters, the native parser throws a SyntaxError. Run payloads through our JSON Validator to pinpoint exact line and column errors before layout.
02. Copy Exact RFC 6901 Pointers for Integration Testing
When asserting values in Jest, Playwright, or Cypress test suites, click any node to copy its exact JSON Pointer (e.g. /cluster/nodes/0/cpu) directly to your clipboard.
03. Export High-Resolution SVG Diagrams for Team Docs
Export vector SVG files from the canvas controls to embed architectural schema maps into your Notion engineering wikis, Confluence documents, or GitHub pull requests.
7. Frequently Asked Questions
Q: What makes JSON data 'complex'?
JSON becomes complex when it exhibits three primary structural patterns: deep hierarchical nesting (depth > 5 levels), mixed polymorphic data types (nested arrays containing heterogeneous objects), and cross-entity relational dependencies (foreign keys, UUID pointers, or schema $ref links). In raw text, these patterns exceed human short-term memory and trigger brace-matching fatigue.
Q: When should I choose a 2D node graph versus a collapsible tree?
Choose a 2D Node Graph (DAG) when you need to understand schema architecture, parent-child entity relationships, and cross-service dependencies across microservices. Choose a Collapsible Virtualized Tree when you need to inspect high-cardinality arrays (thousands of items), edit specific primitive values, or preserve vertical reading flow without horizontal canvas expansion.
Q: Why do standard web visualizers crash on large or complex JSON payloads?
Most web tools execute parsing and graph layout synchronously on the browser's single UI thread. Sugiyama-style layered layout algorithms run with O(|V|² + |E|) computational complexity. Calculating coordinates for hundreds of nodes blocks the event loop for over 100 ms, triggering frame drops and browser unresponsive warnings. Decoupling calculation into a background Web Worker completely eliminates UI freezes.
Q: Is it safe to paste proprietary or production JSON into online tools?
Only if the tool operates with a verified 100% client-side privacy architecture. Many online utilities transmit pasted data to backend servers for processing, creating severe data breach risks for credentials, API tokens, and customer PII. Our visualizer processes all data strictly inside local browser memory via the HTML5 FileReader API with zero network egress.
References, Specifications & Primary Citations
In accordance with our strict Editorial Research & Citation Policy, every technical assertion is substantiated by primary standards, peer-reviewed computer science literature, or verified empirical benchmarks.
- Primary Standard SpecificationAuthor(s): Tim Bray (Ed.) Publisher / Org: Internet Engineering Task Force (IETF) Date: December 2017 Version/Rev: Internet Standard (STD 90)
“Specifies normative JSON grammar, array syntax, object serialization, and character encoding requirements.”
- Primary Standard SpecificationAuthor(s): Paul Bryan, Kris Zyp, Mark Nottingham Publisher / Org: Internet Engineering Task Force (IETF) Date: April 2013 Version/Rev: Proposed Standard
“Defines deterministic string syntax for identifying specific values within a JSON document hierarchy.”
- Primary Standard Academic PaperAuthor(s): Kozo Sugiyama, Shojiro Tagawa, Mitsuhiko Toda Publisher / Org: IEEE Transactions on Systems, Man, and Cybernetics Date: February 1981
“Foundational four-phase layered directed acyclic graph layout framework upon which Dagre and Graphviz are built.”
- Primary Standard SpecificationPublisher / Org: WHATWG / W3C Date: Living Standard
“Normative specification for background execution threads and structured clone message passing.”
- Primary Standard SpecificationAuthor(s): Chris Pettitt Publisher / Org: GitHub Repository (dagrejs) Date: 2023 Version/Rev: v0.8.5
“Algorithmic implementation of Sugiyama layer ranking and vertex cross-minimization evaluated in our tests.”
Source: https://github.com/dagrejs/dagre
Visualize your complex JSON payloads now
Open our free dual-pane workspace. 100% private in-browser Web Worker execution with zero server tracking.